Troubleshooting with VPC Flow Logs

So you built your secure VPC, but things are not working as expected.
Or maybe something changed on the infrastructure and now things are not working.
And as any network engineer knows, every application fault is always due to the network! So how do we prove traffic is getting to our systems and it's not the network?
The answer is VPC Flow Logs.
There is great guidance on Flow Logs in the AWS VPC documentation so I will try not to cover that. What I will try and do is clarify some areas and explain how we can then use them to understand what is going on in our network. Specifically how we can use the AWS CloudWatch Logs console to find out what is happening in our VPC and give us some pointers on what might be wrong.
What is a flow.
The VPC guide defines a flow as "characterized by a 5-tuple on a per network interface basis", which if you have no idea about networks means nothing.
So, firstly what is a tuple, and then what is a 5-tuple? Well, according to good old wikipedia;
An n-tuple is a sequence (or ordered list) of n elements, where n is a non-negative integer
So a tuple is an ordered list and 5 denotes there are 5 items in the list. In networking the tuple is defined as;
source IP address, source port, destination IP address, destination port, transport protocol.
As such using the 5-tuple we can uniquely identifies any UDP or TCP session based on the source and destination (IP and Port) and protocol. So even if there are lots of connections between 2 machines we will be able to identify each of the flows.
So how do I read a flow?
So know we know what a flow is how do we understand them?
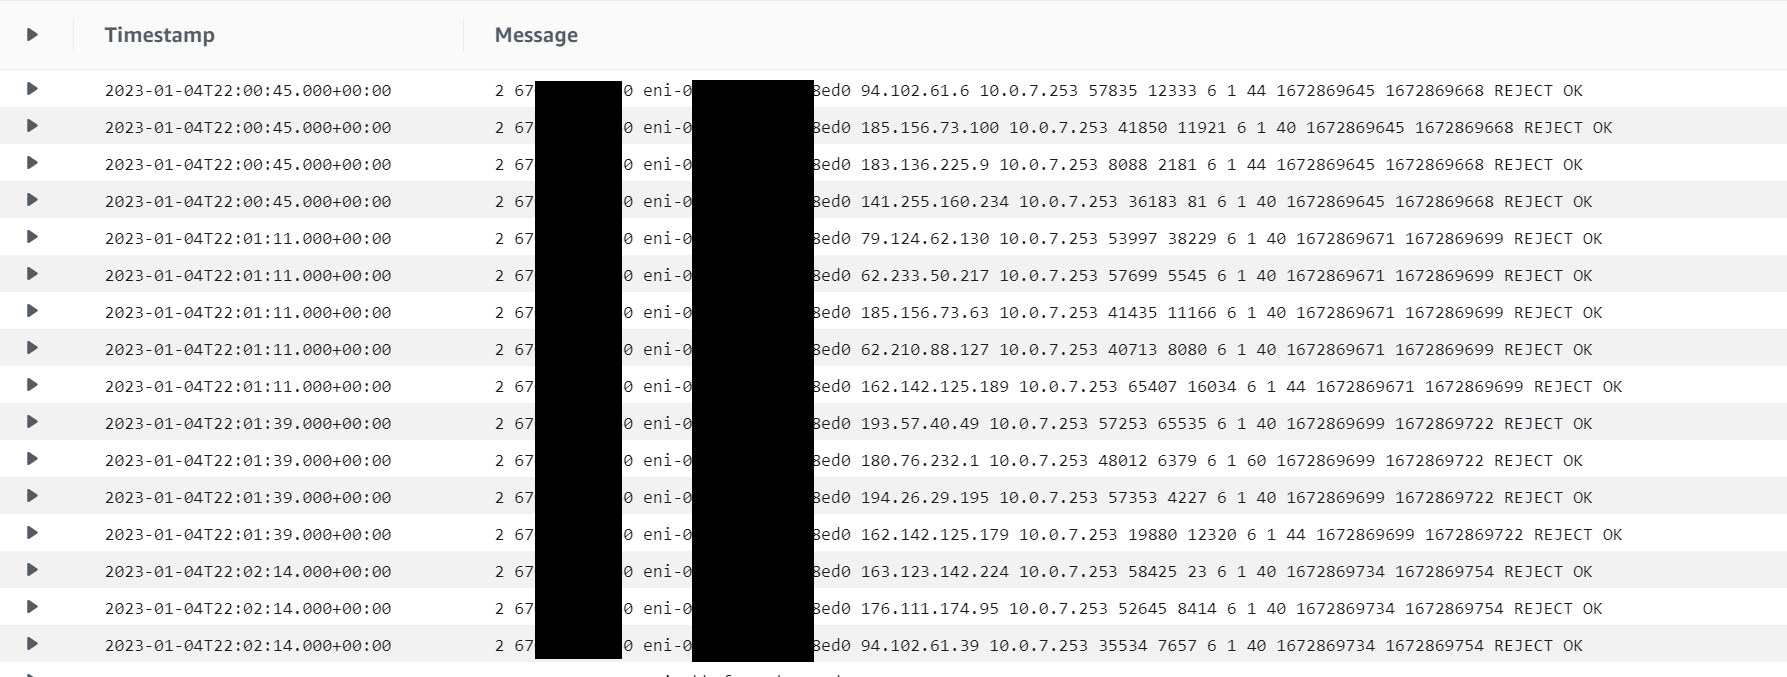
Well lets take a look at some flows for an Instance I've spun up for testing.

So, what are we seeing, as it is more than the 5-tuple defined as a flow.
If you look in the VPC documentation you will see what the fields are that are captured by default and those you can add for further information if needed.
But lets group the fields into 2 categories.
The first group are fields that you will typically get from all network devices that capture traffic flows. So if you enable NetFlow on a Cisco router, JFlow on a Juniper, or even Wire Shark on your PC, you will get these fairly standard set of fields and generally in this order.
- source IP address
- destination IP address
- source port
- destination port
- protocol number
- number of packets
- total number of bytes
- start time
- end time
The second group of fields are AWS' custom field and help you understand the version of Flow Logs being used, where the flow has come from, was the traffic allowed, and was the log data collected successfully.
- flow log version
- AWS account id
- interface id
- action taken
- log status
So, if we look at the first line in the flow logs we see the following:
2 67**0 eni-0**8ed0 94.102.61.6 10.0.7.253 57835 12333 6 1 44 1672869645 1672869668 REJECT OK
So, we can tell that it was generated using Flow Log version 2 (default). The record came from eni-0**edo in account 67**0, useful for consolidated logging solutions.
We can then tell that the source IP was 94.102.61.6 (Some Dutch IP collector) and the target IP was 10.0.7.253 (the eni's private IP). We can also tell that the source port was 57835 and the destination was 12333. The protocol used was TCP (TCP = 6, UDP = 17 and ICMP = 1, full list at IANA). A single packet was sent and that packet was 44 bytes in size. We then also have the start and end time in Unix EPOC (https://www.unixtimestamp.com/ to translate). We can then see that the packet was rejected by either a NCAL or Security Group, and the flow record was captured completely.
Searching the Logs
So how do we find the flows we want in a sea of connections?
Luckily CloudWatch Logs has a built in search functionality as well as ways to filter down the data.
The first thing to do is see if you can find the interface details for the system having issues. If you know your client is talking to a specific host/endpoint than the first way to narrow down the search is to select the log stream for that eni. This will then only show flows that were to or from the specific eni. If you do not know the interface details then you need to use the "Search log group" option but this will have all your flows and be slower to search.
The second thing to do is narrow down the time window. If you know when an issue occurred or are doing live testing you can use the pre-defined time windows or a custom period. Again you can search all the logs but results will be quicker if a smaller set of flows to search.
Finally you can search based on know data from the flows using the search box. For example you could type the source or destination IP address. For example if I know the source system is 172.58.17.20 I could add this as a filter and only get records with that as the source or destination.
Proving connections
So know we know how to read the flows and find the flows we need to look at, how do we prove the network is not an issue?
I've enabled SSH from my local machine to my test instance via both NACL and Security Groups. I have then searched for records that match my source IP of 8*.*.*.*0 in the console. It has returned me 4 "messages" or flow log entries as seen below.

So what are we seeing?
Well, we can see there is a source IP 8*.*.*.*0 talking to the instance. We can also see that the instance is talking to the same IP as there are entries where the IP 8*.*.*.*0 is he destination.
We can then see that the source is talking to the host on TCP port 22 (SSH) and the host talks back to the source on the 57439.
What does this tell us?
The first thing this tell us is that communications have been established. The source has sent data to the host and the host has replied.
We can tell that communication has been established and it is not just coincidence that the source and host tried to talk to each other at the same time by two pieces of information.
Firstly the ports pairs (source/destination) are identical between the two records. When a system responds to a session it will always send data back the port that the request came from. These "high ports" or "ephemeral ports" are randomly assigned when a connection is made and a rarely open and listening for connections.
Secondly is the start and end time stamps. These are identical for each pair of flows. If this we two separate connections based on the number of packets and data sent we would expect to see variation in the end times, even if the start time happened to coincide.
Finally, we see two sets of flows with the same 5-tuple. This would indicate that all the records are flows that are part of the same session between the client and host.
What if I don't see this?
So what if you don't see these pairs of flow or you see flows with REJECT?
Well this means that the connection has not been established.
If the flow log entry shows REJECT this means that either the NACL or Security Group is blocking the flow. If there is a single entry that is showing REJECT (as in the first screen shot) then this means the inbound flow is being rejected. If there are two flows but it is the second flow showing REJECT then this means it is an outbound rule that is blocking the traffic.
If you are seeing a single log entry that is showing ACCEPT but no return flow then this means the application or service is not running or, if running, not listening for requests on the specified port. In these instance check the application/service is up and running and that it is configured to listen for requests on correct port.
Hope you have found this useful and helps you to understand your networks a little better. In a future article I'll take a look at how we can analyze and visualize the data in flow logs.
Till then, safe travels on your cloud journey and go rock your AWS solutions.


Member discussion